NT5CC256M8JQ-EK specs deep dive: performance limits
Theoretical per‑chip peak bandwidth for DDR3‑1866 is straightforward on paper: 1866 MT/s translates to ~1,866 MB/s for a single x8 device. This piece translates those datasheet numbers into practical, measurable limits for the NT5CC256M8JQ-EK, covering throughput, latency, power/thermal, and signal‑integrity boundaries. Engineers will find a prioritized test matrix and tuning checklist designed to map datasheet claims to real system behavior and identify the most common bottlenecks that reduce sustained performance.
Goal and scope: quantify expected sustained MB/s and latency ranges, identify the controller and board factors that drive deviation from peak, and provide actionable experiments and measurements to diagnose and improve real‑world performance. Keywords embedded naturally include NT5CC256M8JQ-EK, DDR3L SDRAM and performance throughout the analysis.
1 — Part snapshot: architecture & key specs (background)
1.1 Key electrical, physical and speed specs (1–2 bullets of content direction)
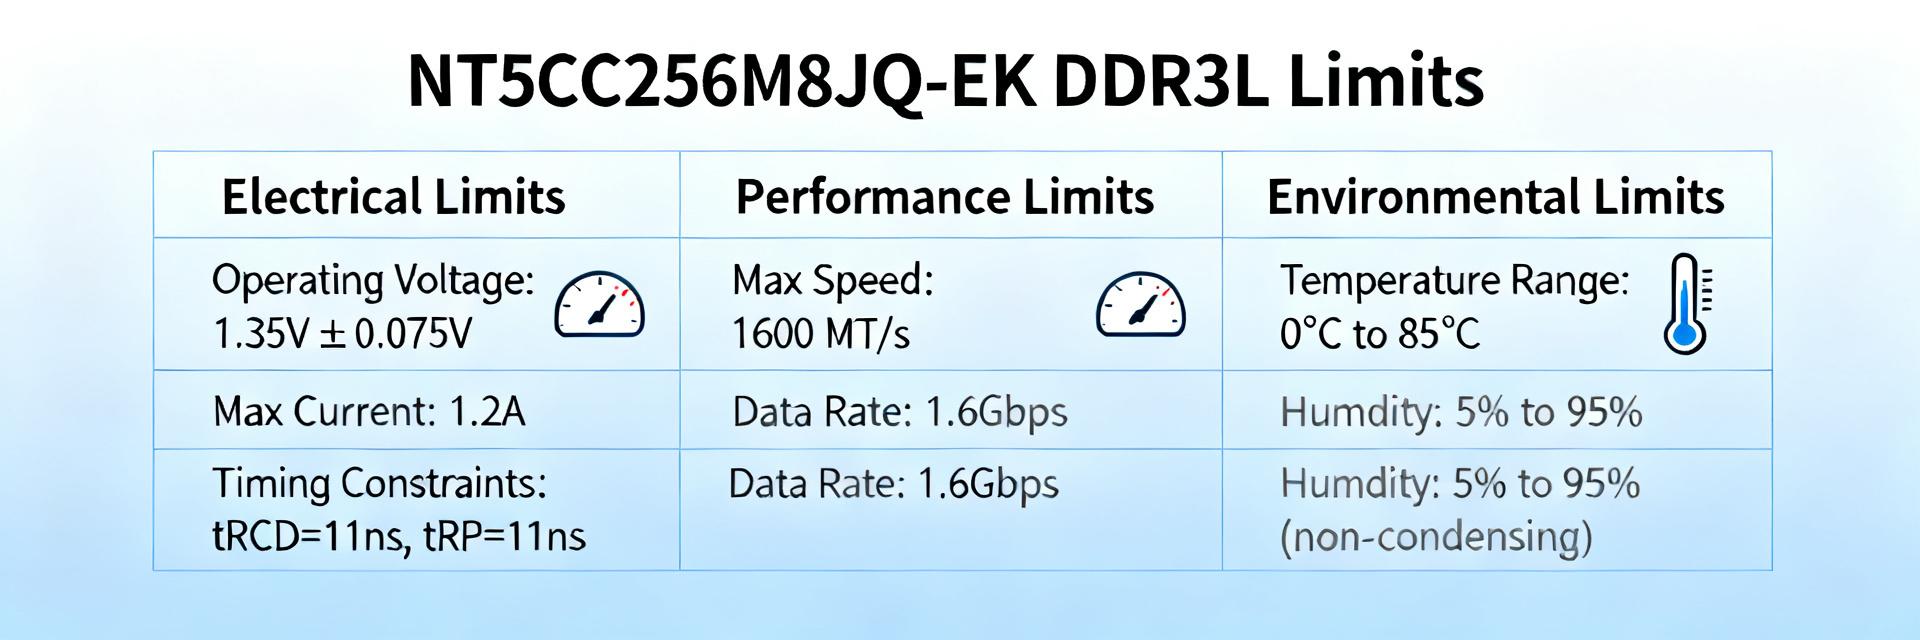
Core published values to extract before testing: density 2Gb organized as 256M x8, speed grade DDR3‑1866, nominal VCC = 1.35 V (DDR3L), TFBGA‑78 package, and standard commercial operating temperature range. Internally the device uses eight banks and an 8n prefetch architecture; typical address/command pin counts and bank organization match JEDEC DDR3 conventions. Verify package and land‑pattern against BOM and board mechanical files prior to layout and assembly.
1.2 JEDEC compliance & footprint implications
JEDEC DDR3/L compliance implies standard timing sets, training sequences, and controller expectations; a JEDEC‑compliant controller should handle initial training but board layout and fanout matter. BGA fanout for TFBGA‑78 requires careful ball map translation and matched DQ routing; common PCB checks include recommended land pattern, solder mask openings, and via‑in‑pad avoidance on critical DQ lanes. Before assembly, confirm package, ballmap, and recommended land pattern match the BOM and PCB fabrication data.
2 — Theoretical bandwidth vs. real throughput (data analysis)
2.1 Calculating theoretical peak and effective bandwidth
Calculation: 1866 MT/s × 8 DQ bits = 14,928 Mbps per device → divide by 8 to convert to bytes ≈ 1,866 MB/s per x8 chip. Formula readers can reuse: Peak MB/s = (MT/s × DQ width) / 8. When multiple chips are interleaved or on separate ranks, aggregate bandwidth scales linearly in ideal conditions, but real systems rarely reach summed theoretical peaks due to shared buses and controller limits.
2.2 Practical throughput limits and common throughput drains
Top real‑world drains on throughput include controller overhead, command/turnaround penalties, bank conflicts, non‑ideal access patterns (random vs sequential), and system arbitration. To quantify, capture sustained sequential MB/s, random IOPS, read‑to‑write turnaround, and an efficiency ratio of measured/peak. Expect measured sustained sequential throughput per chip to be meaningfully below 1,866 MB/s depending on controller and interleave strategy; profiling should isolate whether the loss is protocol overhead or board/SI related.
3 — Latency: timing parameters and real-world impact (data analysis / method)
3.1 Key timing parameters, conversions and examples
Key timings: tCL (CAS), tRCD, tRP, tRAS. At DDR3‑1866 the data rate clock is 933 MHz (half‑rate UI), giving a cycle ≈ 1.072 ns. Conversion formula: time_ns = cycles × (1 / (MT/s / 2)). Example conversions shown below are useful to include in test reports as both cycles and ns.
| Timing | Cycles | Approx. ns |
|---|---|---|
| CL11 | 11 | ~11.8 ns |
| tRCD11 | 11 | ~11.8 ns |
Report latency in both cycles and ns in test results; cycles matter for controller tuning while ns shows absolute delay experienced by software and systems prejudiced by real time.
3.2 How timing, command rate and interleaving affect observable latency and performance
Command rate (1T vs 2T) changes command bus timing and can add 1 clock delay to many transactions; bank interleaving reduces average latency by enabling overlapping activates and precharges. Page hits vs misses strongly affect average latency—single‑bank hot loops will show worst latency due to frequent tRP/tRCD penalties. Experiments: toggle 1T/2T, run single‑bank hammer and full‑page sequential patterns to quantify latency and throughput delta per change.
4 — Power, thermal and signal-integrity constraints (method & case considerations)
4.1 Power envelope, DVFS/leakage and implications for sustained performance
Supply expectation is 1.35 V; dynamic power grows with I/O toggling, refresh rate, and higher activity factors, while static leakage is temperature dependent. Measure board VCC under stress with a current sense resistor or inline meter and record temperature. Instrumentation should include a current probe, a thermal probe on the BGA center, and logging for voltage drops—thresholds where errors rise are implementation specific, so use progressive stress runs to identify V/I/temperature points where stability degrades.
4.2 Thermal limits, PCB layout and signal‑integrity best practices
TFBGA‑78 thermal conduction is limited to ball vias and plane coupling; hotspots typically appear near the die center and high‑activity address/command buffers. Recommended PCB stack‑up includes solid power planes for return, matched length DQ pairs, fly‑by address/command routing, and controlled impedance traces. Check reflow profiles and run SI checks—SI‑induced errors include training failures, elevated BER, and ambiguous eye diagrams; use eye monitors and BER stress to expose them.
5 — Test plan and optimization checklist (method guide + action recommendations)
5.1 Minimal test matrix to map limits (benchmarks, patterns, metrics)
Ordered test plan: 1) power‑on training verification; 2) basic read/write functional checks; 3) sequential burst throughput; 4) random small‑block reads/writes (4K/64K); 5) single‑bank stress and hammer tests; 6) refresh and long‑duration stress; 7) temperature sweep. Record MB/s, latency (ns), IOPS, error counts, VCC, and temperature. Define pass/fail thresholds up front (e.g., <0.1% error, steady‑state throughput within X% of baseline).
5.2 Tuning levers and risk matrix (what to change, expected gain, and risks)
Tuning knobs: timing (tCL/tRCD/tRP) for latency vs stability, command rate 1T/2T, drive strength and ODT, Vref and voltage margining, interleaving and rank configuration, and low‑power state settings. Validate changes incrementally and escalate from controller settings to voltage margins. Always run extended stress at target temperature after any tuning change to detect intermittent failures before deployment.
Summary (10–15% of article)
- Theoretical peak ≈ 1,866 MB/s per x8 device at DDR3‑1866; measured performance will be lower due to controller overhead and system effects.
- NT5CC256M8JQ-EK (DDR3L SDRAM) behavior is strongly shaped by timing, command rate, bank interleaving, and board‑level SI and thermal factors.
- Follow the ordered test matrix: validate training, measure sequential/random throughput, stress power/thermal, then tune timings and voltage margins with careful validation.
FAQ
How do I verify NT5CC256M8JQ-EK achieved advertised bandwidth in my system?
Run sustained sequential read/write bursts while logging MB/s, VCC, and temperature. Compare measured sustained MB/s to the theoretical 1,866 MB/s baseline and compute an efficiency ratio. If efficiency is low, isolate controller overhead, bank conflicts, or SI issues using targeted single‑bank and interleaved patterns.
What latency reporting is most useful for DDR3L SDRAM testing?
Report both cycles and ns for tCL, tRCD, tRP and average observed read/write latency. Cycles are useful for controller tuning; ns shows absolute delay to software. Include distribution metrics (median, p95) to reveal tail latency caused by page misses or refresh interference.
What are the fastest checks to catch SI or thermal issues affecting performance?
Run memory training validation, an eye‑diagram or BER test, and a short temperature sweep while doing repeated large sequential bursts. Look for training failures, rising BER, increasing error counts, or sudden throughput drops correlated with temperature or voltage sag to pinpoint SI or thermal limits.
How do command rate and bank interleaving resolve throughput bottlenecks?
Moving from 2T to 1T timing saves one cycle per command transaction when signal integrity allows. Multi-bank interleaving overlaps activate and precharge operations across all 8 internal banks, eliminating idle wait cycles typical of single-bank access loops.