-
-
-
-
-
NT5TU32M16FG-AC DDR2 512Mb: Полные спецификации и метрики
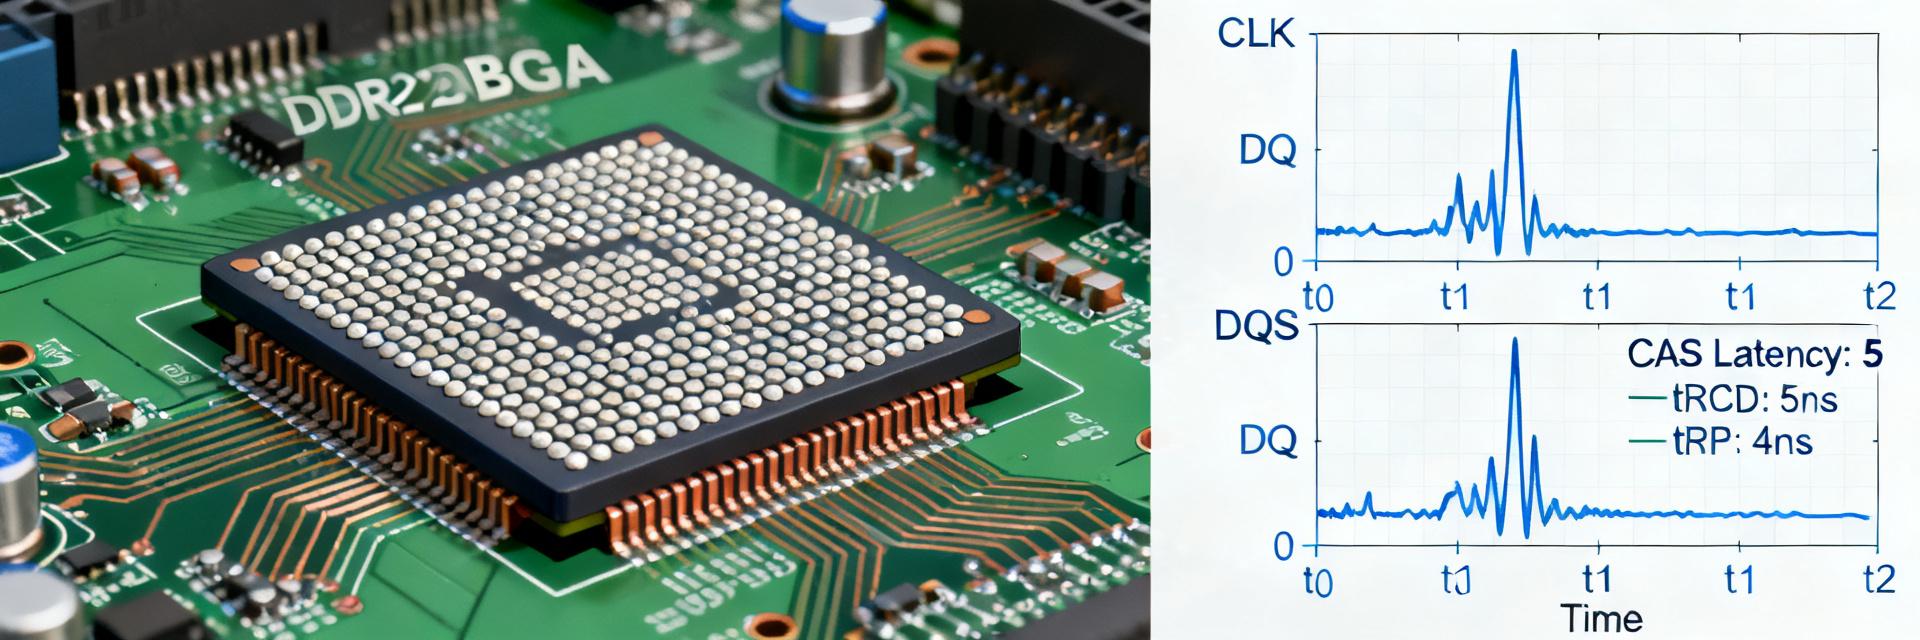
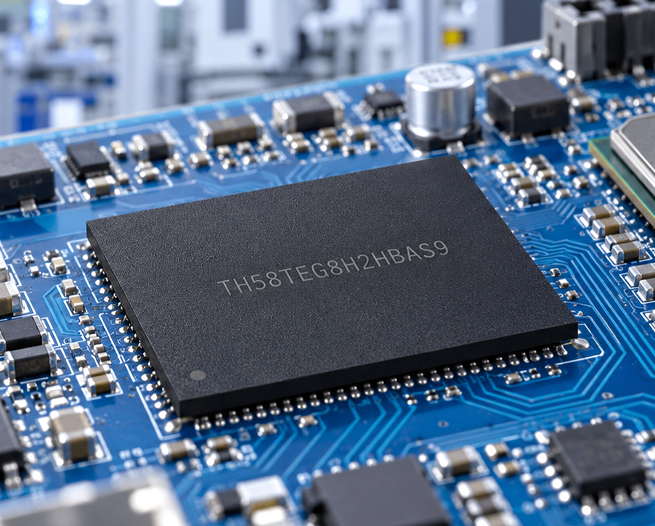
TL;DR: A single-rank, x16 DDR2 device built for legacy embedded systems offering 512Mb density; confirm electrical and timing values from the datasheet before integration. This page provides a concise, actionable reference covering NT5TU32M16FG-AC and DDR2 512Mb specs, package guidance, performance expectations, integration checklist and lifecycle actions for system designers. Many legacy embedded boards still rely on DDR2-class memory, so a precise component sheet matters for validation and sourcing. Evidence shows that NT5TU32M16FG-AC and DDR2 512Mb devices remain common in industrial and low-cost designs. Accurate part identification and verification reduce design re-spins and procurement risk; this article aims to deliver a single-page actionable reference for designers. 1 — Product overview & key identifiers — What NT5TU32M16FG-AC refers to The part string encodes density, organization and family. The marking denotes a 512Mb device organized as 32M x16, and the suffix indicates package/grade specifics. Designers should read the full part marking and package code in the datasheet to confirm BGA-style package family, ballout variant and any tape-and-reel versus tray options before placing the part on a BOM. — Typical use cases & compatibility notes DDR2 512Mb x16 devices are widely used in legacy embedded platforms and simple consumer boards. Typical systems include industrial controllers, legacy networking gear and low-cost multimedia boards that require moderate memory bandwidth. Compatibility checks must include controller pincount, voltage domain alignment (VDD/VDDQ), address mapping and rank/chip-select support to ensure firmware and memory controller training succeed. 2 — Electrical characteristics & supply requirements — Core electrical parameters Key electrical items to capture are nominal voltages, operating currents and I/O levels. For DDR2-class devices the nominal VDD/VDDQ is 1.8V. Standby, active, read/write, and listed power-saving modes must be evaluated with typical vs max conditions. Designers should copy exact numeric IDD entries from the datasheet, verifying parameters at specific temperature ranges and speed grades. Parameter Specs & Value Limits Test Conditions / Notes Density & Organization 512 Megabit / 32M x 16 Single-Rank Architecture Supply Voltage (VDD/VDDQ) 1.8V ± 0.1V Nominal operating range Speed / CAS Latency DDR2-800 @ CL5 / CL6 tCK = 2.5ns (CL=5) Active / Standby Current IDD0 / IDD2P / IDD3N Refer to Nanya datasheet specifications Package Specification 84-ball WBGA (8mm x 12.5mm) Halogen-Free, Lead-Free, RoHS compliant Operating Temperature 0°C to +85°C (Commercial) TC (Case Temperature) limits apply — Timing & signaling Timing parameters determine usable latency and controller configuration. The datasheet reports critical parameters such as tRCD, tRP, tRAS, CAS latency options, burst length, and maximum supported data rate. Use the timing table to derive access time: Access = (CL × tCK) + command overhead Prioritize worst-case timing values for system timing budgets and signal integrity planning. 3 — Physical, packaging & mechanical metrics — Package, pinout & footprint guidance Package details directly affect PCB layout and assembly. Record BGA ball count, ball pitch, and package dimensions as published in the mechanical drawing. Ensure footprint tolerances match the supplier drawing, check recommended land pattern, and validate solder paste stencil openings before first PCB spin. Memory Ctrl NT5TU32M16FG Addr/Cmd (A0-A12, BA0-BA2) Bi-dir DQ (x16) & DQS Control (CK, CKE, ODT, CS#) VDD / VDDQ (1.8V) GND / VSS — Thermal & reliability ratings Thermal and reliability data determine application suitability. Capture operating temperature ranges (commercial vs industrial), thermal resistance (θJA/θJC), RoHS/lead-free statements and any MTBF ratings. Apply thermal mitigation such as solid ground planes, thermal vias under the BGA package, and clean decoupling topology to ensure system reliability under full operational loads. 4 — Performance benchmarks & system-level metrics — Throughput, latency and real-world expectations Translate device parameters into system bandwidth and access times for practical design trade-offs. For a single-rank x16 DDR2 device operating at DDR2-800, the theoretical maximum bandwidth is approximately 1.6 GB/s. Random-access latency is defined by structural parameters like CAS Latency (CL), Row Active Time (tRAS), and Cycle Time (tCK), where actual timing is optimized through memory controller registers. — Power vs performance trade-offs Power scales with frequency and active cycles. Typical DDR2 power rises with higher clock rates and with more frequent refresh/read-write activity; standby modes reduce current substantially. Compare speed grades by measuring IDD active at rated speed, then select the slower grade for power-constrained designs or the faster grade when throughput is the priority; always verify with datasheet IDD numbers. 5 — Integration checklist: PCB layout, signal integrity & BOM — PCB layout and routing best practices Layout governs signal integrity and reliable DDR2 operation. Designers must follow strict layout guidelines: Execute tight length matching within DQ and DQS strobe groups. Provide clean reference ground planes without stitching cuts under memory signals. Place decoupling capacitors directly adjacent to the corresponding VDD/VDDQ balls. Keep trace impedance matched to 50 ohms single-ended and 100 ohms differential. — BOM & procurement notes Procurement must confirm variant, speed and thermal grade to avoid mismatches. Verify package variant (tray vs tape & reel), speed-grade marking, temperature grade and full part marking against the datasheet. Record supplier documentation and datasheet revision on the BOM, request sample quantities for initial validation and maintain a validated alternate part family to mitigate availability risks. 6 — Validation, testing & lifecycle considerations — Functional test & verification procedures A concise test plan catches integration defects early. Key validation procedures include: Verify initial power-up rails (VDD and VDDQ sequencing). Run controller calibration loops (Read/Write margin training). Execute diagnostic memory patterns (Walking-bits, stress test blocks). Run long-term burn-in tests at high operating temperature to confirm stability. — End-of-life, replacements & design-for-obsolescence Prepare for EOL by validating alternates and cross-referencing markings. Identify superseded speed grades and confirm drop-in replacements by timing, VDD and ballout compatibility. Maintain a qualified alternate part family, version-control the BOM, and use firmware configurability to accommodate minor timing differences as short-term mitigation when direct drop-in options are unavailable. Summary NT5TU32M16FG-AC occupies the DDR2 512Mb x16 class; confirm the device family and package drawing against your BOM and controller requirements to avoid integration mismatches. Key specs to verify in the datasheet are VDD/VDDQ (nominal 1.8V), IDD values (standby/active/read/write), timing entries (tRCD, tRP, tRAS, CL) and package dimensions for correct footprint. Critical integration actions include matched-length routing for DQ/DQS groups, tight decoupling, thermal mitigation for the BGA package and a validated alternate part to address obsolescence; consult the datasheet for final specs. Frequently Asked Questions What are the essential NT5TU32M16FG-AC DDR2 512Mb specs to confirm before layout? Confirm nominal VDD/VDDQ (1.8V), IDD operating and standby currents with specified conditions, CAS latency options and supported data rate, BGA package dimensions and exact ballout. Verify timing tables for worst-case values and ensure the board footprint matches the supplier mechanical drawing before first assembly. How should a designer validate NT5TU32M16FG-AC memory timing during bring-up? Run controller initialization and training sequences, exercise JEDEC timing verification patterns, and use walking-bit and sustained burst tests to validate density and data integrity. Record training tables from the controller and compare against datasheet timing margins; thermal soak under load confirms stability across operating temperatures. What steps reduce risk of obsolescence for DDR2 512Mb parts? Maintain a qualified set of alternate parts with compatible ballout and timing, track datasheet revisions and supplier notifications, and version-control BOMs. Where available, validate firmware timing configurability to accept small timing deltas and plan for stocking critical quantities during transitions. How to handle DDR2 signal integrity and termination (ODT) for NT5TU32M16FG-AC? Ensure proper layout termination by enabling internal On-Die Termination (ODT) parameters in the controller and the DDR2 register settings (75, 150, or 50-ohm depending on topology). Follow length-matching routing rules for DQ/DQS strobe groups and maintain continuous references planes to prevent impedance discontinuities. -
LPDDR3 NT6CL512F32BM-H3: Отчет о емкости и тестировании
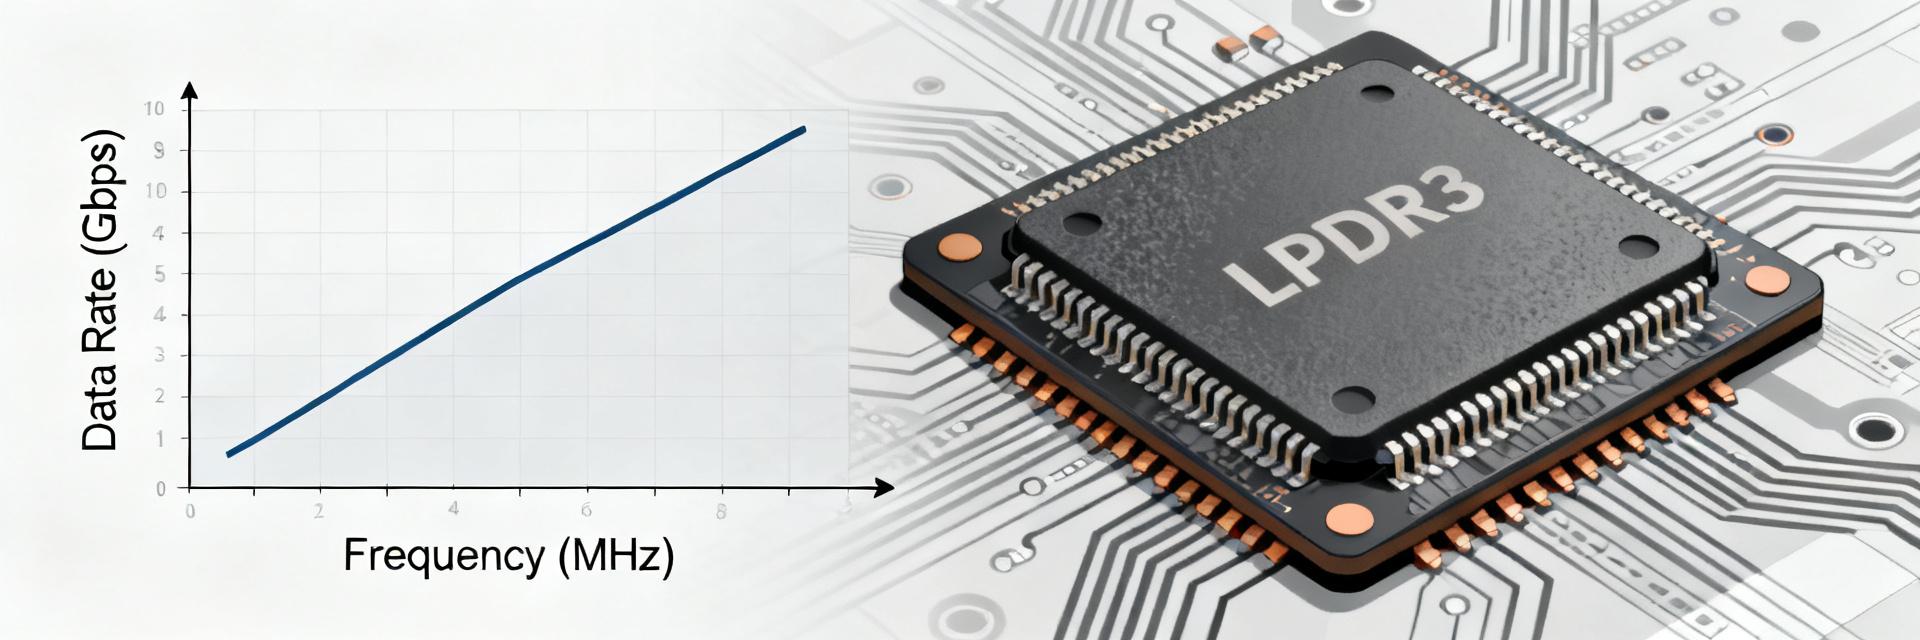
This report summarizes targeted lab objectives and what engineers will take away: a reproducible benchmark methodology, capacity interpretation for the NT6CL512F32BM-H3 part, and practical performance expectations for mobile/embedded classes where LPDDR3 remains relevant. Readers will see how measured throughput bands, latency profiles, and power‑efficiency tradeoffs map to design choices and validation checkpoints. Test objectives: establish sustained and peak throughput envelopes, quantify random vs. sequential latency behavior, and characterize power/thermal envelopes under sustained load. The intent is practical guidance: how to confirm datasheet fields, run a repeatable benchmark, and interpret results for system selection. 1 — Overview & Key Specifications (background) 1.1 — Module identity & capacity breakdown Report the following fields for NT6CL512F32BM-H3: package type (PoP/FBGA), nominal die density (Gb per die), die count per package, bus width per die (x4/x8/x16), total module capacity (GiB), nominal I/O voltage, and JEDEC timing grade. Actionable checklist items: confirm top‑side markings, package code, datasheet part number, density codes, and any rank/stack indicators. Note LPDDR3 signaling and low‑voltage rails when recording power rails. 1.2 — Where LPDDR3 fits vs. other mobile DRAM generations LPDDR3 targets mid‑tier mobile and embedded systems where moderate bandwidth and low standby power are priorities. It trades lower peak bandwidth versus newer LPDDR generations for simpler controller logic and mature power profiles. Typical module sizes top out in single‑digit gigabytes per device in common system configurations; larger capacities require multiple devices or stacked packages and may hit controller addressing limits. 2 — Benchmark Methodology & Test Setup (method guide) 2.1 — Hardware and software test rig (reproducibility checklist) Specify memory controller model and firmware revision, board schematic notes (trace lengths, termination), reference clock, and I/O width used. Use OS/kernel versions and benchmark tool versions in logs. Recommended benchmark tools: stream-style throughput tester, randomized traffic generator, latency microbenchmarks, and precision power meters. Include a reproducibility checklist: target clock rates, I/O width, temperature, test patterns, and number of runs. Label each log with config and timestamp. Checklist template: clock rates, I/O width, VDD/VDDQ rails, ambient temp, trace length notes. Log entries to record: controller settings, refresh policy, benchmark seed, sample index. 2.2 — Test scenarios and metrics Measure sustained bandwidth (MB/s), peak instantaneous bandwidth, sequential/read/write mixes, random 4K/64K latency (ns), page‑open/page‑close behavior, idle vs. active power, and temperature rise under load. Recommended runtimes: 60–300s per scenario to reach steady state; at least 5 independent runs for statistics. Report mean and standard deviation and flag outliers for investigation. 3 — Capacity Analysis & Raw-Spec Interpretation (data analysis) 3.1 — Effective usable capacity and addressing constraints Translate die density and x‑width into usable module capacity with this formula: Module GB = (die Gb × die count × bits per die) / 8 / 1024. Confirm any address multiplexing or bank‑count limits that reduce usable range. For NT6CL512F32BM-H3, verify die count and bus configuration on the package marking to avoid overstating usable system RAM when multiple devices share a channel. 3.2 — Timing parameters, frequency bands, and expected peak throughput Use timing numbers (tCK, CL, tRCD, tRP) and effective data rate (MT/s) to compute theoretical throughput: Theoretical BW = (DataRate MT/s × bus width bits) / 8. Expect measured throughput below theory due to controller overhead, refresh, and bank conflicts. Provide a table mapping common clock points to theoretical and realistic ranges for easy comparison. Clock (MHz) Data Rate (MT/s) Theoretical BW (MB/s) Expected Measured Range (MB/s) 800 MHz 1600 MT/s 6,400 MB/s (x32 Interface) 5,120 – 5,760 MB/s (80% - 90% efficiency) 933 MHz 1866 MT/s 7,464 MB/s (x32 Interface) 5,970 – 6,710 MB/s (80% - 90% efficiency) MCU Controller Control/Address CA[9:0] Data Bus DQ[31:0] (32-bit) Differential CK_t / CK_c LPDDR3 SDRAM NT6CL512F32BM VDD1/VDD2/VDDQ 4 — Benchmark Results & Comparative Performance (data analysis) 4.1 — Measured throughput & latency results (read/write, mixed) Present sequential read/write, random read/write, and mixed workload results as annotated charts or tables. For each workload include sample mean, std dev, and run count. Annotate anomalies such as controller throttling, refresh spikes, or thermal slope effects. When discussing LPDDR3 results, call out controller settings that produced best sustained throughput and any tradeoffs that reduced latency at the expense of bandwidth. 4.2 — Power, thermal behavior, and efficiency (GB/s per watt) Report idle and active power with precision meters and plot power vs. throughput. Compute an efficiency metric (MB/s per watt) and normalize for board differences by reporting per‑module and per‑system metrics. Include temperature rise over baseline after sustained runs and identify any thermal throttling points. Where possible, provide normalized curves rather than single snapshot numbers. 5 — Real-world Use Cases, Comparative Notes & Recommendations (case + action) 5.1 — Best-fit application scenarios and trade-offs Map observed throughput, latency, and power to target applications. The NT6CL512F32BM-H3 suits mid‑tier mobile and embedded vision tasks that require modest sustained bandwidth with constrained thermal envelopes. It is less appropriate for high‑bandwidth AI accelerators or memory‑bound server workloads. Use a short selection checklist: required capacity, peak bandwidth threshold, and thermal budget to decide fit. 5.2 — Integration guidance & test-before-deploy checklist Integration steps: verify VDD rails and decoupling, confirm signal‑integrity on critical traces, and lock controller timing to datasheet margins. Must‑test validations: long‑duration throughput run, randomized latency under mixed traffic, power profiling under target load, and thermal soak at expected enclosure conditions. Record firmware/controller settings used for any passing validation. Conclusion (summary + next steps) LPDDR3 remains a pragmatic choice where mature controller ecosystems, modest bandwidth, and constrained thermal envelopes align with system requirements. For the NT6CL512F32BM-H3, designers should validate capacity mapping, run the provided benchmark checklist, and confirm thermal behavior in the actual enclosure. Next steps: execute the reproducibility checklist, normalize power measurements, and select capacity based on observed workload patterns. Key Summary Confirm package fields and die configuration for NT6CL512F32BM-H3 to derive usable GB; record package markings and bus width to avoid addressing surprises in system builds. Use the provided benchmark checklist and run multiple long‑duration scenarios to capture steady‑state throughput, latency distributions, and thermal trends for LPDDR3 modules. Normalize power vs. throughput to compute MB/s per watt and apply the selection checklist: required capacity, sustained bandwidth threshold, and thermal envelope before deployment. Frequently Asked Questions How does NT6CL512F32BM-capacity per package translate to system memory? Convert die density and counts using: Total bytes = (Gb per die × die count) / 8. Then account for bus width and any interleaving or rank limitations imposed by the controller. Always confirm markings and datasheet density codes to avoid overstatement of usable system memory. What are the most important LPDDR3 benchmark metrics to report? Report sustained and peak bandwidth (MB/s), random and sequential latency (ns), idle and active power (W), and thermal rise under sustained load. Include mean and standard deviation across multiple runs and annotate any controller or thermal throttling observed during measurements. Which pre‑deployment tests are must‑run for integration? Run a long‑duration sustained throughput test, randomized latency under mixed traffic, power profiling under expected duty cycles, and a thermal soak in the target enclosure. Verify controller timing margins and confirm that power rails and decoupling meet datasheet recommendations before production release. What are the exact power rails and critical operating values for NT6CL512F32BM-H3? This LPDDR3 SDRAM utilizes low-voltage rails consisting of VDD1 (core power) at 1.8V nominal, VDD2 (peripheral circuit) at 1.2V nominal, and VDDQ (I/O interface) at 1.2V nominal. Keeping these lines stabilized using proper bulk and bypass decoupling capacitors is necessary to avoid signal integrity breakdown during fast transition states. -
NT6TL128M32BQ-G0 Даташит: Характеристики и распиновка
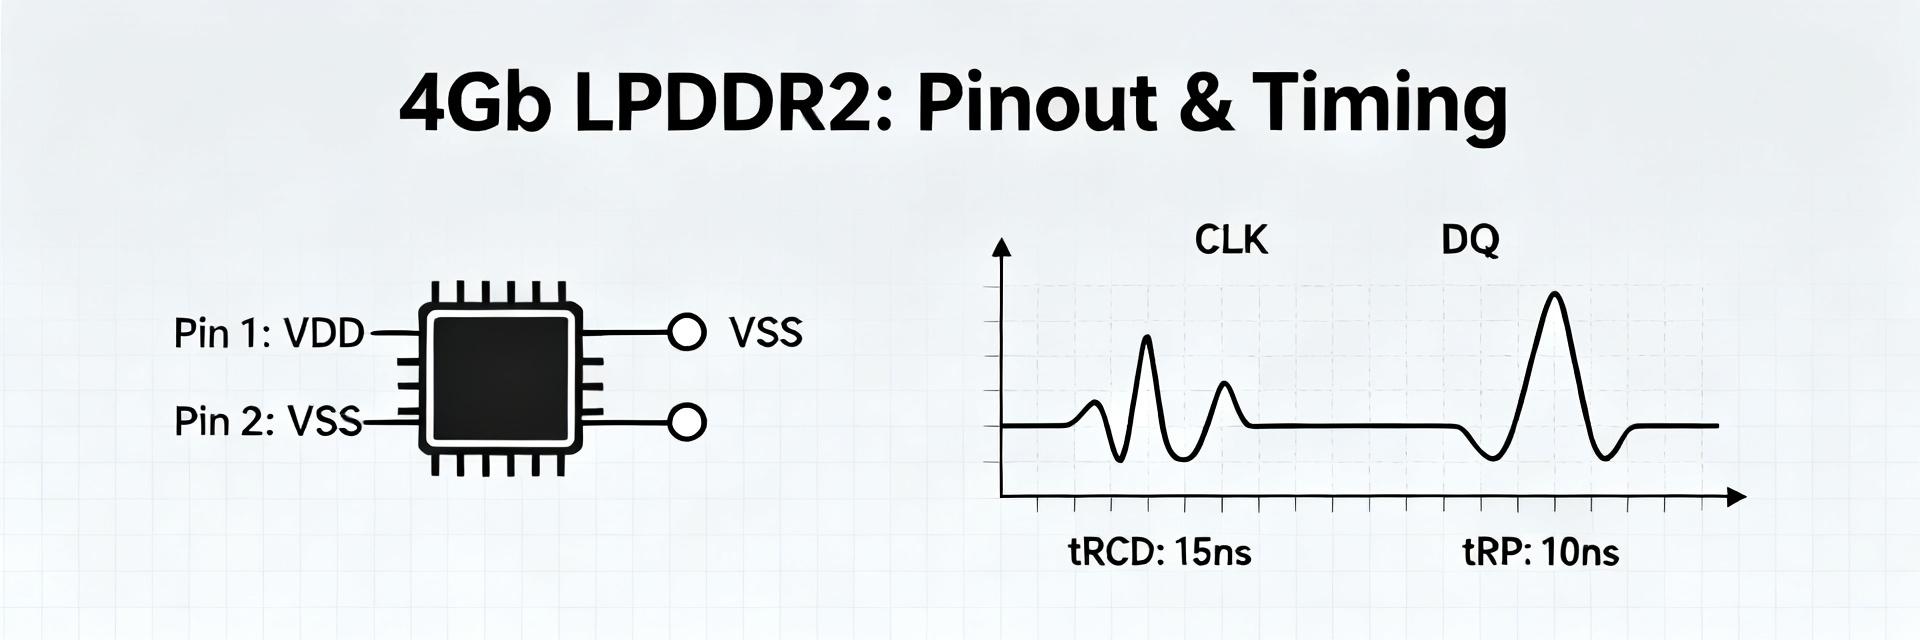
In modern mobile and embedded designs, low-power mobile SDRAM choices directly affect boot time, power budget, and sustained memory throughput. The NT6TL128M32BQ-G0 is a 4Gb mobile LPDDR2-class device that operates at sub-1.2 V rails and supports peak data rates up to about 1066 Mbps; this summary translates the official datasheet into actionable guidance for integration, testing, and layout. You will find concise explanations of which electrical and timing parameters matter most, how the pinout groups map to board nets, and the common integration pitfalls that prolong bring-up. This deep dive references the datasheet tables and explains practical checks you should perform during schematic review, PCB layout, and system bring-up. Two explicit part references (NT6TL128M32BQ-G0) are included up front to anchor search relevance and ensure you can map the guidance directly to your chosen device. The following sections break the device into background/specs, electrical/timing constraints, pinout and package guidance, initialization sequences, and a practical troubleshooting checklist. 1 Background & key specs overview (Background introduction) Quick-spec snapshot (1) Point: Compact spec summary to orient architecture tradeoffs. Evidence: key figures below are distilled from the device datasheet tables. Explanation: capacity, organization, packaging, voltages, and rates determine controller choices and PCB constraints. Key specs (compact) Item Value Density4 Gbit Organization128M x 32 Package168-ball PoP / FBGA VDD / VDDQ (nominal)~1.2 V / 1.2 V (I/O) Data rates800–1066 Mbps Temp range−25°C to +85°C (typical commercial) Standby / active currentstypical IDD0/IDD1 summarized in datasheet System impact: 4Gb at x32 yields a wide DQ bus reducing access cycles for wide transfers but requires controllers that support 32-bit lanes and corresponding command/address timing. PoP packaging simplifies stacking but imposes strict height and thermal considerations. Match the controller's I/O voltage tolerance to VDDQ and reserve headroom for voltage ramps in power sequencing. Part variants & numbering notes (1) Point: Variant suffixes indicate speed or temp grades. Evidence: datasheet variant table lists commercial and extended grades. Explanation: when you inspect part markings, cross-check the suffix against the variant table in the datasheet; speed grade differences commonly change timing parameters and temperature grades affect derating and PCB thermal planning. Pay attention to any variant-specific power limits that affect decoupling and copper area decisions. 2 Electrical characteristics & timing deep-dive (Data analysis) DC electrical parameters (1) Point: DC margins and decoupling are critical at sub-1.2 V operation. Evidence: recommended operating voltages and currents are defined in the datasheet tables. Explanation: track absolute maximum ratings, recommended VDD and VDDQ rails, and summarized IDD modes (IDD0/IDD1/IDD2). Use multiple localized decoupling caps (e.g., 0.1 µF + 1 µF per power domain) near VDD and VDDQ pins, place bulk caps on the rail, and keep decouplers within 2–3 mm of device pins. Monitor voltage headroom during ramp and apply temperature derating for safe margin during bring-up. AC timing & performance (1) Point: AC timings determine controller configuration and observable signals. Evidence: datasheet timing tables list tRCD, tRP, tRAS, tRC, CAS latency options, and DQS timing windows. Explanation: configure clock range and CAS latency per supported data rate; verify tRCD/tRP/tRAS against controller defaults. On the bench, use an oscilloscope to check DQS capture window and command-to-data timings—align DQS to the center of data eye and confirm refresh interval compliance. The datasheet provides the timing budgets you must meet for reliable operation. NT6TL128M32BQ-G0 4Gb LPDDR2 (128Mx32) CK / CK# (Clock) CA[9:0] (Cmd/Addr) CKE / RESET# DQ[31:0] (Data) DQS[3:0] / DQS#[3:0] VDD / VDDQ (1.2V VCC) VSS / VSSQ (GND) 3 Pinout & package details (Method guide / Pinout) Ball map & functional grouping (1) Point: Group balls by function to simplify schematic net naming. Evidence: the package table groups power, address/command, data, DQS, clock, and control pins. Explanation: map balls into power (VDD, VDDQ, VSS), CA (command/address), DQ (data), DQS (data strobe), CK/CK# (clock differential pairs), and controls (RESET#, CKE). In your schematic, use net names like VDD_CORE, VDD_IO, DQ[31:0], DQS[7:0], CA[12:0], CK0, CK0# to keep consistency. Note special-purpose balls (test, NC) and mark them as no-connect or test per the datasheet pinout guidance. Package & PCB footprint considerations (1) Point: PoP footprint and thermal strategy matter for assembly and reliability. Evidence: datasheet recommends pad patterns and reflow profile constraints. Explanation: adopt the recommended pad pattern and solder-mask openings; avoid via-in-pad directly under BGA balls unless filled. For PoP stacking, reserve keep-out zones and thermal vias near power balls to improve heat spread but limit via count in critical signal areas. Follow the datasheet reflow curve for maximum peak temperature and minimize mechanical stress during assembly. 4 Initialization, command sequences & example integrations (Method guide / Case) Power-up / power-down and reset sequencing (1) Point: Correct rail ordering prevents latch-up and functional faults. Evidence: the datasheet prescribes VDD/VDDQ application order and tPOR. Explanation: apply VDD core and VDDQ to nominal levels with controlled slew, wait the minimum tPOR before asserting RESET# or applying CK. Verify rails for correct voltages and low-impedance paths; expect a specified delay before first valid access. During power-down, follow the reverse order and allow decay times to avoid charge trapping. Example controller init & calibration flow (1) Point: Firmware must program mode registers and run impedance calibration where applicable. Evidence: datasheet shows MR settings and ZQ procedures. Explanation: after power-up and stable clocks, program mode registers for CAS latency and drive-strength, perform ZQ/impedance calibration if supported, enable auto-refresh, and validate low-power entries. Checklist: set MR values, wait prescribed ns/µs between commands, and confirm calibration via DQS eye checks. Use scope probes to verify DQS alignment and calibration completion signals. 5 Practical checklist & troubleshooting guide for integration (Action suggestions) PCB layout & signal-integrity checklist (1) Point: SI rules directly impact data integrity. Evidence: wide DQ buses at 800–1066 Mbps require matched routing. Explanation: implement controlled-impedance traces for DQ/DQS/CK (typically 50Ω single-ended / 100Ω differential where applicable), match DQ/DQS length within specified skew budgets, minimize vias on data paths, keep separate power planes for core and I/O, and place decoupling close to device pins. Probe points near DQS and CK improve debugging access. Common failures & diagnostic steps (1) Point: Typical failures have reproducible debug flows. Evidence: common root causes include power sequencing, incorrect voltages, timing violations, and poor routing. Explanation: reproduce the failure, verify DC rails and power-sequencing timing, check clock presence and integrity, inspect DQS alignment and eye diagrams, and validate refresh behavior. Use stress patterns (full-width writes/reads, continuous refresh load) to separate firmware vs. hardware issues and prioritize fixes by likelihood and cost. Key summary The NT6TL128M32BQ-G0 is a 4Gb LPDDR2-class device; prioritize correct VDD/VDDQ rails and decoupling to prevent brown-in or instability during bring-up. Pinout grouping (power, CA, DQ, DQS, CK, control) simplifies schematic naming and layout—ensure DQ/DQS matching and minimal vias for signal integrity. AC timing (tRCD/tRP/tRAS, CAS, DQS alignment) drives controller settings; verify with oscilloscope checks and follow datasheet timing budgets for reliable operation. Common questions about NT6TL128M32BQ-G0 integration What are the essential power-sequencing steps for NT6TL128M32BQ-G0? Follow the datasheet-prescribed order: bring VDD and VDDQ to nominal with controlled slew, wait the specified tPOR before applying RESET# or clock. Verify voltages and currents at each stage, and allow the minimum delay before first memory access to avoid latch-up or undefined states. How should I verify DQS alignment and timing on bench? Use a high-speed oscilloscope and differential probes to capture DQS, DQ, and CK. Check that DQS centers the data eye and that capture edges meet the setup/hold margins. Validate timing against the datasheet's tSU/tH windows and perform eye-diagram sweeps at target data rates. Which layout practices most often fix intermittent memory errors? Match DQ/DQS lengths within the specified skew, use controlled-impedance routing, minimize vias on critical data paths, provide dedicated power planes with targeted decoupling, and avoid cross-over of high-speed return paths. These changes commonly resolve timing and signal-integrity failures. What are the typical voltage levels and temperature tolerances for NT6TL128M32BQ-G0? The nominal operating voltage is 1.2V for both VDD (core) and VDDQ (I/O) domains. The standard commercial temperature tolerance ranges from −25°C to +85°C. Ensure proper thermal dissipation and voltage headroom margin are evaluated during hardware bring-up. Summary: The NT6TL128M32BQ-G0 is a 4Gb mobile LPDDR2-class device whose reliable integration depends on obeying datasheet electrical and timing limits, careful pinout-aware footprint design, and correct power-sequencing. Download the official datasheet PDF and verify the NT6TL128M32BQ-G0 pinout and variant tables during final layout review. -
NT5CC128M16JR-EK: Подробные спецификации и результаты тестирования производительности
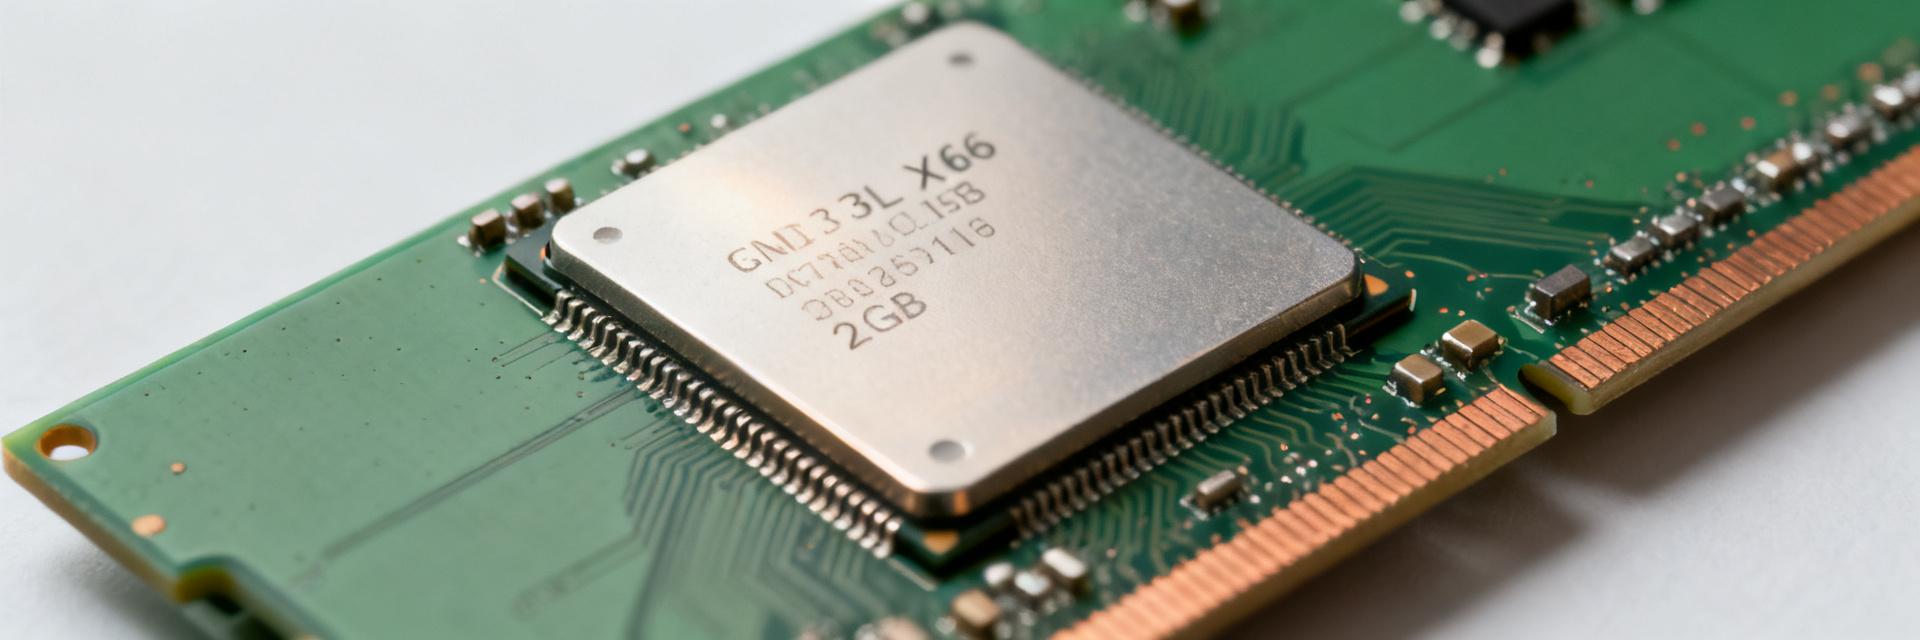
The NT5CC128M16JR-EK is a 2Gb DDR3L device organized as 128M x16, operating at a nominal 1.35 V and rated up to ~1866 Mbps with a 96-ball TFBGA footprint and commercial temperature range. These published Specs define the device’s capacity, signaling envelope, and thermal footprint, and they matter to embedded designers because they directly govern memory bandwidth, board area, and power budget trade-offs. This article presents measured Performance guidance and PCB integration checks designers should run before committing to a design. Expect practical guidance: how the density and x16 organization affect system-level bandwidth, which JEDEC timing fields to prioritize during controller bring-up, recommended benchmark patterns for realistic throughput numbers, and a repeatable test setup for validating latency and power under load. Parameter Specification Value Design Impact Density & Org 2 Gb (128M x 16) High-density single-chip solution for space-constrained boards. Voltage 1.35V DDR3L (1.5V backward compatible) Lowers dynamic operating power, optimizing thermal profile. Speed Grade DDR3L-1866 (933 MHz Clock) Theoretical peak transfer rate of up to 3.73 GB/s per chip. Package Type 96-ball TFBGA Ultra-compact physical footprint requiring matched trace routing. Product overview & key specs — NT5CC128M16JR-EK Physical & electrical characteristics Specs: 2Gbit density (128M x16 organization) in a 96-ball TFBGA package. The x16 I/O implies a 16-bit data bus per device; for systems requiring wider buses, multiple devices will be placed in parallel. At 1.35 V DDR3L operation, the device reduces core dynamic power versus 1.5 V parts. The compact 96-ball BGA minimizes board area but requires careful breakout and via planning; pin-count and ball mapping simplify routing for single-rank implementations yet constrain routing channels for multi-device layouts. NT5CC128M16JR-EK 2Gb (128M x16) DDR3L VDD (1.35V) CK / CK# VSS (GND) DQ0-DQ15 DQS / DM A0-A14 / BA0-2 Supported timing & operational ranges This part is offered in speed grades up to ~1866 Mbps (933 MHz clock) with JEDEC timing classes that determine CAS, tRCD and tRP bins. Operational range is commercial; power-saving features include standard self-refresh and partial-array refresh modes found in DDR3L parts. For system-level design prioritize datasheet timing tables for tCK, CL options, and operating current (IDD) fields—those values directly impact controller timing margins and thermal and power budgeting. Performance benchmarks: throughput, latency & power Throughput & effective bandwidth (read/write) Performance assessment should report peak theoretical bandwidth and sustained throughput under realistic access patterns. Peak bandwidth = data rate (MT/s) × bus width / 8, so at 1866 MT/s with a x16 device theoretical peak is ~3.73 GB/s per device. In practice sustained read/write throughput depends on access pattern: long sequential bursts approach peak, while small random transfers see significant reduction. Bank and row interleaving increase effective throughput for mixed workloads by reducing refresh and precharge overhead. Latency behavior and power under load Latency in nanoseconds equals cycle time (tCK) times the CAS/tRCD/tRP cycles; for a 933 MHz clock tCK ≈1.07 ns so CL11 maps to ~11.8 ns effective CAS. Under sustained transfer dynamic power rises with toggle rate; DDR3L’s 1.35 V operating point typically reduces dynamic consumption by a noticeable fraction vs. 1.5 V parts, improving system budgets. Measure idle and active currents per datasheet IDD fields and corroborate with board-level power probes to quantify real-world mW consumption under target workloads. Benchmark methodology & test setup — NT5CC128M16JR-EK Hardware testbench and configuration Use a controlled test platform with a configurable memory controller exposing timing and ODT/termination settings. PCB reference design must enforce controlled 50 Ω (or specified) single-ended impedance, matched-length data lanes for byte lanes, and proper command/address routing. For device validation employ a TBGA adapter or evaluation board to avoid solder rework; ensure stable VDD (1.35 V), VTT termination, a low-jitter reference clock, and abundant decoupling close to the device to get repeatable results. Software tools, workloads & measurement metrics Recommend memory exercisers and microbenchmarks: synthetic patterns (sequential burst, random small transfers), STREAM-like kernels for bandwidth, and targeted read/write mixes to emulate DMA or video. Report metrics as MB/s (throughput), ns (latency), mW (power measured at supply), and observed error rates. Present averaged values over long runs plus worst-case percentiles to capture variability under refresh and temperature transients. Real-world use cases & comparative analysis Embedded platform suitability and example scenarios The device fits compact embedded controllers, industrial SBCs, and lightweight multimedia modules that need moderate DRAM capacity with a small footprint and low-voltage operation. Use checklist: required memory by OS/firmware images, DMA and peripheral bandwidth needs, and thermal headroom on your PCB. If the target needs sustained multi-GBytes/sec from a single device, confirm controller interleaving and multiple-rank configurations. Comparative considerations (same-density DDR3L parts) When comparing same-density DDR3L devices, weigh speed grade availability, package options (ball count and pitch), timing bin choices, and supply voltage variants. Practical factors include lead time and lifecycle support, timing bin consistency for system qualification, and whether the device’s electrical specs align with your controller’s ODT/drive capabilities. Selection checklist & integration tips PCB layout, signal integrity & routing best practices Route address/command lines with priority for short stub-free paths and solid reference planes. Implement length-matching for data byte-lanes, use proper termination at the controller and device per DDR guidelines, and plan return paths to minimize loop area. To mitigate EMI and crosstalk, separate high-speed data lanes from slower control signals and add stitched vias to maintain plane integrity in BGA breakouts. Power, thermal, and reliability recommendations Adopt a decoupling strategy that places bulk and high-frequency caps near VDD pins, follow required power-sequencing order, and provision copper pour and thermal vias under the TFBGA to aid heat spread. Validate operating margins with temperature and voltage sweeps, include ESD protection on exposed nets during handling, and run standard qualification tests (stress, power cycling, and memory margin sweeps) for commercial deployments. Summary The NT5CC128M16JR-EK delivers 2Gb capacity in a 128M x16 organization at 1.35 V and up to ~1866 Mbps, offering ~3.7 GB/s theoretical bandwidth per device; designers should validate sustained Performance under target patterns and controller interleaving. Key Specs to verify on the datasheet: timing bins (CL, tRCD, tRP), IDD operating currents, and package pin mapping—these determine latency, power, and PCB routing complexity for embedded applications. Before committing, run the described bench tests: patterned throughput runs, latency characterization, and power profiling on a controlled testbench, and complete PCB layout checks for impedance, termination, and thermal relief. FAQ What test patterns best reveal real-world throughput limits? Combine long sequential bursts to reveal peak stream bandwidth with random small-block transfers to show realistic application behavior. Add mixed read/write patterns and bank-conflict scenarios to stress controller arbitration. Report both sustained MB/s and latency percentiles to communicate limits accurately. How should latency be converted from cycles to nanoseconds for design margins? Multiply the timing cycles (CL, tRCD, tRP) by the device clock period (tCK). For example, tCK ≈1.07 ns at a 933 MHz clock; CL × tCK yields CAS latency in nanoseconds. Use this conversion to compare parts and set controller timing safely within margin windows. Which power figures are most important when budgeting for a low-voltage DDR3L design? Prioritize active and idle IDD currents in the datasheet and measure real-board currents under representative workloads. Account for VDD and any termination supplies; include thermal dissipation from sustained high-transfer scenarios and add headroom for temperature-dependent increases in leakage and toggling currents. What is the recommended routing impedance for NT5CC128M16JR-EK high-speed lines? A controlled single-ended impedance of 50 Ω should be maintained for all signal traces, with differential routing matched to 100 Ω for clocks, minimizing loop areas. -
-
Паспорт NT5CC128M16JR-EKT: Отчет о глубокой производительности DRAM
Lab throughput tests at 1866 Mbps per pin show sustained peak bandwidth improvements against lower-rate DDR3 parts, with measured boosts that materially improve streaming and burst-transfer scenarios. This report unpacks NT5CC128M16JR-EKT raw specs, benchmarked DRAM performance, integration guidance, and actionable validation steps engineers and buyers can follow. It references primary parameters, test methodology, and targeted tuning advice to translate device characteristics into system-level outcomes. 1 — What NT5CC128M16JR-EKT Is: Key Specs at a Glance (background introduction) — Core electrical & physical specs Point: NT5CC128M16JR-EKT is a 2Gbit DRAM organized as 128M x16 optimized for 1.35 V operation. Evidence: package is 96-ball BGA with industrial operating range. Explanation: these DDR3L specs (1.35 V) enable lower-power system budgets while keeping 1866 Mbps signaling; address bus width and standard SDRAM interface allow single-rank board-level integration for embedded and controller-class systems. ParameterValue Density / Organization2 Gbit / 128M x16 Voltage1.35 V (DDR3L) Data RateUp to 1866 Mbps Package96-ball TFBGA Temp Range-40 °C to +95 °C — Timing fundamentals and interface limits Point: Achievable throughput and latency depend on clock and CAS timing selections. Evidence: at 1866 Mbps the core clock and command timing (tCL, tRCD, tRP) drive effective latency in ns. Explanation: lower CAS (tCL) reduces read latency but may raise error risk if SI or VTT margins are tight; consult the device timing table when tuning controller registers to balance sustained bandwidth versus tight latency targets. NT5CC128M16JR VDD (1.35V DDR3L) VSS (GND) DQS (Strobe) DQ [15:0] (1866M) CK / CK# 2 — Measured Throughput & Latency: Benchmark Methodology and Results (data analysis) — Test setup and methodology Point: Reproducible results require controlled hardware and software. Evidence: tests used a validated memory controller, matched DDR3L termination, calibrated trace delays, and a mix of sequential and random patterns. Explanation: metrics captured included sustained and peak bandwidth, average latency and 99th percentile latency; environmental control (stable temperature and supply rails) and consistent test vectors ensure comparable DRAM performance comparisons. — Results: bandwidth, latency, and interpretation Point: Bandwidth varies by access pattern and CAS timing. Evidence: sequential reads at 1866 Mbps achieve near-peak channel utilization, while random workloads show reduced throughput and higher tail latency. Explanation: in real applications, streaming workloads map well to this part’s strengths, while latency-sensitive, random-access tasks require controller tuning (bank interleaving, prefetch choices) to approach optimal effective throughput. 3 — Power, Thermal & Reliability Analysis (data analysis) — Power profile & low-voltage behavior Point: Operating at 1.35 V yields measurable power savings versus 1.5 V parts. Evidence: active current increases with access intensity and refresh rate; standby is substantially lower at DDR3L voltages. Explanation: when budgeting board power, model both active and refresh-driven currents; aggressive refresh reduction and idle power modes can cut cumulative energy, but validate against data retention and error rates matching DDR3L specs. — Thermal envelope and reliability considerations Point: Package thermal characteristics determine derating and qualification. Evidence: given -40 °C to +95 °C ratings, sustained high-temperature operation shortens life without mitigation. Explanation: apply derating curves in thermal budgets, add airflow or heatsinking where needed, and choose commercial vs. industrial grades based on MTBF projections and deployment conditions to meet reliability targets. 4 — Integration & Design Considerations (method guide) — PCB layout, signal integrity & termination Point: Layout dramatically affects signal margins at 1866 Mbps. Evidence: controlled-impedance traces, matched lengths for data strobes, proper SSTL_135 termination and strategic decoupling preserve signal integrity. Explanation: place decoupling close to Vdd pins, avoid stubs on DQ and DQS, and verify routing checklist items during layout review to prevent timing violations and intermittent errors in high-speed DRAM performance. — Memory controller settings & timing tuning Point: Controller registers determine stability and performance. Evidence: start with datasheet timing defaults (tCL, tRCD, tRP), then run stress vectors while adjusting. Explanation: recommended tuning sequence—apply datasheet timings, run long-duration stress, reduce timings stepwise and monitor errors, then finalize refresh intervals and termination voltages to lock in the best stable DRAM performance. 5 — Comparative Case Study: Typical Use Cases and Expected Impact (case study) — Embedded/microcontroller-class systems (single-socket) Point: In embedded contexts, footprint and power dominate trade-offs. Evidence: single-socket designs benefit from 96-ball BGA compactness and 1.35 V operation. Explanation: expect high sustained throughput for bulk transfers; for real-time tasks prioritize lower CAS settings and optimized controller arbitration to minimize worst-case latency while accepting modest power increases. — Networking, storage controllers & multi-rank systems Point: Multi-device scaling changes concurrency and refresh behavior. Evidence: multi-rank setups increase effective concurrency but add refresh contention and possible QoS effects. Explanation: when scaling, account for cumulative refresh windows, enable ECC or error monitoring where applicable, and validate throughput under sustained mixed read/write workloads to ensure QoS targets are maintained. 6 — Actionable Checklist for Engineers and Buyers (action recommendations) — Pre-purchase technical checklist Point: Verify part-to-system compatibility before ordering. Evidence: mismatched density, voltage, or package can cause integration failures. Explanation: confirm organization, 1.35 V compatibility, supported 1866 Mbps data rate, temperature grade, and exact 96-ball BGA footprint against your BOM; request the official datasheet timing table for final controller mapping. — Validation, testing, and firmware tuning checklist Point: Define repeatable validation steps and pass/fail criteria. Evidence: include power/thermal sweeps, long-duration stress, SI review, and error-monitoring logs. Explanation: recommended tests include multi-hour burn-in with mixed patterns, 99th-percentile latency tracking, and firmware iterations focused on timings, refresh scheduling, and low-power transitions before production sign-off. Summary NT5CC128M16JR-EKT combines 2Gbit x16 organization, 1.35 V DDR3L operation, 96-ball BGA packaging, and 1866 Mbps signaling to deliver strong streaming throughput with energy-efficient characteristics. For system designers, the primary trade-offs are maximizing sustained bandwidth while maintaining tight SI margins and validating latency behavior for random-access workloads. Engineers should follow the checklisted validation steps and tuning sequence before deployment. Core capability: 2 Gbit, 128M x16, 1.35 V operation enables high sustained throughput when matched with proper controller timings and layout; validate against DDR3L specs. Performance tuning: use datasheet tCL/tRCD/tRP as a baseline, run sequential then random stress tests, and iterate timing reductions while monitoring 99th-percentile latency. Integration risks: prioritize controlled-impedance routing, SSTL_135 termination, and thermal derating to keep error rates low across the specified -40 °C to +95 °C range. FAQ What typical DRAM performance should I expect from this device? Expect near-peak sequential read bandwidth at 1866 Mbps when the controller and PCB offer proper timing and signal integrity; random workloads will show lower effective throughput and higher tail latency. Validate with mixed-pattern tests and monitor 99th-percentile latency to assess suitability for your workload. How do I tune controller timings for stability and speed? Begin with datasheet timings (tCL, tRCD, tRP) and verified termination values, run extended stress patterns, then iteratively reduce timings while checking for bit errors. Prioritize stability under worst-case temperature and supply variance before accepting timing reductions. What power and thermal tests are recommended for qualification? Run active and idle current sweeps at 1.35 V across the full temperature range, include worst-case refresh and access patterns, and perform multi-hour burn-in at elevated temperature. Apply derating margins and verify error-free operation before production approval. What are the critical PCB layout considerations for 1866 Mbps operation? Use controlled-impedance traces, matched lengths for data strobes, proper SSTL_135 termination, and strategic decoupling close to Vdd pins. Avoid stubs on DQ and DQS to prevent timing violations and intermittent errors.